Part 3:
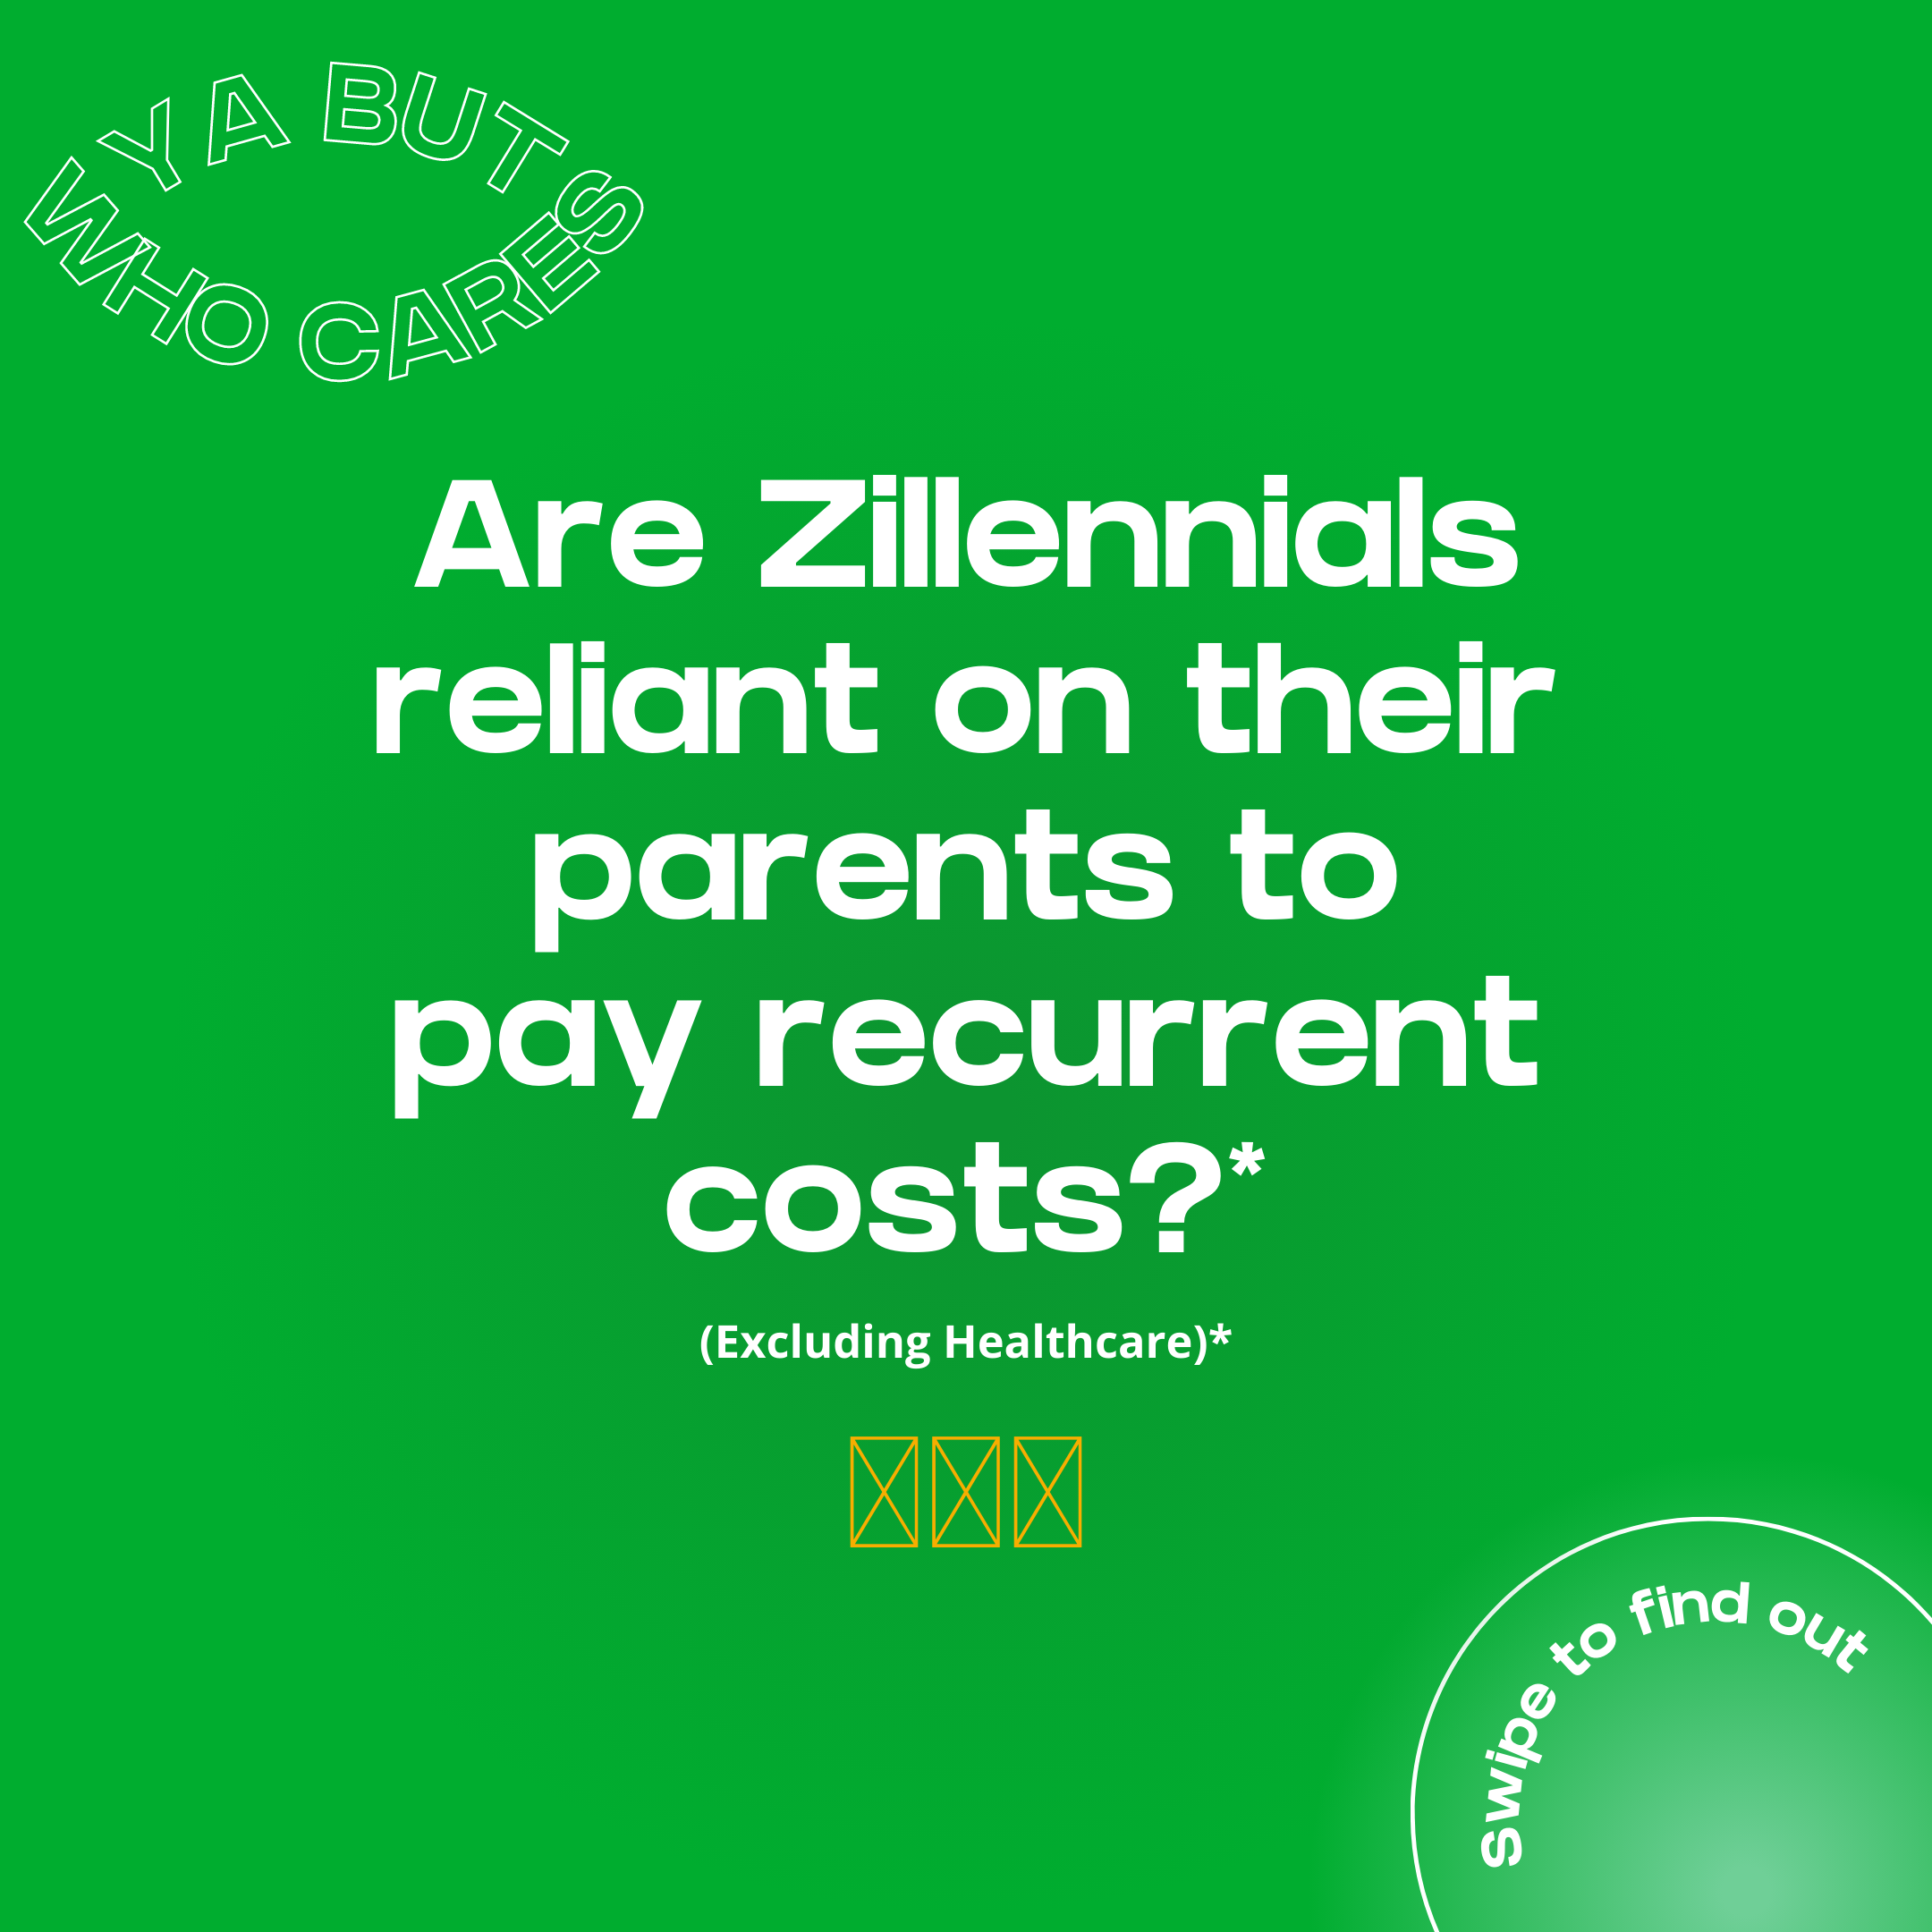
Are zillennials reliant on their parents to pay recurring costs?
The Zillennial Investing Report
Ever wonder how much your peers rely on their parents to sustain their lifestyle? In a 2019 survey from Pew Research Center, 45% of young adults aged 18 to 29 said they had received financial support from their parents in the past year. The same survey found that 55% of all adults think young people these days are too reliant on their parents. Many studies suggest that Millennials and Gen Z'ers may need the help because they are financially worse off than their parents. A widely covered report titled "The Fading American Dream" found that just half of 30-year-olds in 2014 earned more than their parents did when they were 30, compared to 92% of 30-year-olds in 1970. But according to Pew Research Center, the percentage of young adults who are financially independent (defined as having an income of at least 150% of the poverty level) has not shifted dramatically in recent decades.
In this section of the "ya, but who cares?" disposable income survey, we sought to understand how much of a role parents play in the finances of a highly-educated sample. The goal wasn't to find the individuals whose parents chip in for one-off purchases. We wanted to identify how many Zillennials are reliant on their parents for the recurring costs necessary to sustain their lifestyles, including rent, phone bills, car payments, streaming services, and student loans. Health insurance and medical expenses were excluded from this survey because nearly 50% of our respondents are younger than 26 and have the option to stay on their parents' plan.
Insight30% of Zillennials respondents are reliant on their parents for recurrent costs (excluding health care).
30% of the Zillennials surveyed said they rely on their parents to help them cover recurring expenses, including rent, phone bills, car payments, streaming services, and student loans. 30% is a lower share than seen in some other surveys -- a 2019 Pew Research Center analysis found 45% of young adults had received financial support from their parents. The difference could reflect how our survey sought to hone in on the more heavily reliant individuals who need their parents' support to cover costs.
On the other hand, you might expect our survey respondents to need more assistance covering bills than the average Zillennial. While the overall sample is more highly educated than the general population, they also tend to live in cities and regions of the country where a dollar doesn’t get you very far. Statistically speaking, the median income of a bachelor's degree holder is 75% more than a high school graduate. 80% of our survey respondents are college-educated, putting their median income at 50,000, according to Statista. $50,000 sounds great until you're splashing out on dinners and accounting for sky-rocketing rent prices in New York City. Considering that 62% of our respondents live in the New York CIty area, they may be more likely than other Zillennials to be living beyond their means and need additional help … which brings us to our next insight.
InsightRespondents in the West and Northeast were significantly more likely to rely on their parents for help with recurring expenses than respondents in the Midwest and South.
As stated above, the purchasing power of a dollar is highly dependent on where you live. States in the Northeast and West consistently outrank those in the Midwest and South in terms of cost of living. According to the Missouri Economic Research and Information Center, New York and California have the 2nd and 3rd highest cost of living out of all U.S. states, after Hawaii (or the 3rd and 4th highest if you include D.C.). The five states with the lowest living costs are Mississippi, Kansas, Alabama, Oklahoma, and Georgia.
City-specific rankings reveal a similar pattern. Los Angeles is the least affordable city in America, while New York comes in at number eight, according to CNBC. Six of the top 10 most affordable cities, including Sioux, South Dakota, and Madison, Wisconsin, are in the Midwest or South. The other four are out West in Nevada or Utah.
All this is to say that those who live in cities like Los Angeles and New York, as many of our respondents do, have to dish out a lot more cash to cover their needs. It may not be possible for many of these individuals to achieve the standard of living they expect without help. So next time you see that friend with an entry-level salary who balls out every night on drinks at Soho House or tables at Acme, you can thank their parents. If not, they are likely ripping through their savings and on the road to serious debt, and it may be time for a wellness check.
InsightWhite respondents are 55% more likely to have their parents assist in paying for recurrent costs than their Black counterparts and 31% more likely than their Asian counterparts.
Parents who financially support their adult children in meaningful ways need to be relatively well off. Since the average white family has 10x more wealth than the typical Black family, it makes sense that more white parents are capable of pitching in to cover their older children's expenses.
Based on this assumption, it is not clear why Asian respondents were less likely to receive help with recurring costs from their parents than white respondents. The median household income for Asian families in the United States $94,903 in 2020—is higher than any other race or ethnicity. But this statistic demonstrates how averages don’t tell the full story. Asians also have the widest income gap of any racial group, with the top income brackets earning 10x as much as the lowest.
InsightFemale respondents were 22% more likely to have their parents assist in paying for recurrent costs
Ok, we would like to coin a new phrase here: the spiderman effect. You know, the meme where all the spiderman are pointing at each other?
This phrase is relevant here because of the many compounding explanations for this statistic -- all centered around the gender pay gap and stereotypical gender roles. On average, women in the United States earn less than men. When comparing the median annual income of full-time female and male employees in 2019, Pew Research found that women were paid 82% of what men made. Women of color brought home even less.
Gendered stereotypes also take some of the blame. According to traditional gender norms, men are the providers, and parents may expect their sons to become financially independent sooner than their daughters. Here's another one: women are not as financially literate as men. Unfortunately, stereotypes are powerful, and the deeply-rooted ones can influence reality. A study by Annuity found that women of all ages are three times as likely as men to say they can't afford to save for retirement and have significantly lower rates of financial literacy.
However, an analysis of data from 2022 suggests times may be a-changin' (marginally). The new study found that in 22 of 250 U.S. metropolitan areas, women under 30 earn the same amount or more than their male counterparts. And more forces are working against these systemic problems than ever before. One example is the proliferation of communities like Ellevest, Alinea Invest, and BoysClub.eth, which have created educational spaces for women to learn how to invest and own their financial future.